Our group wanted to develop the capability to visualize and characterize the radar returns of small components based on the work of an academic paper. The team of 4 (Computer Engineer, 2x Mechanical Engineers, and a Project Manager) were given 10 weeks to develop the system.
As the Computer Engineer on the team, I was responsible for the software development, acquistion system, control system, and data processing. I created an ASP.NET application that orchestrated the whole process from power on through collection. I wrote a serial interface to control the signal generator, used an arduino duo as a 1 megasample analog to digital convertor, reverse engineered the messages to control the servo for the linear rail, and generated a correlated WAV file with 2 channels for the radar return data and the pulse data. The system ran on a Raspberry Pi 4 running Linux.
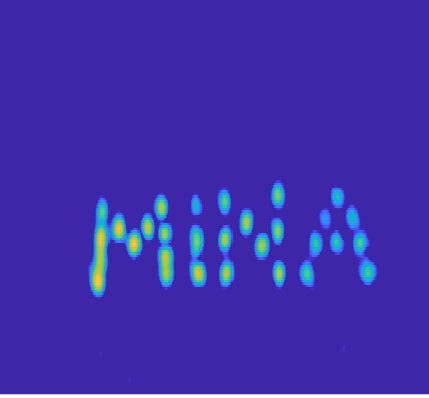
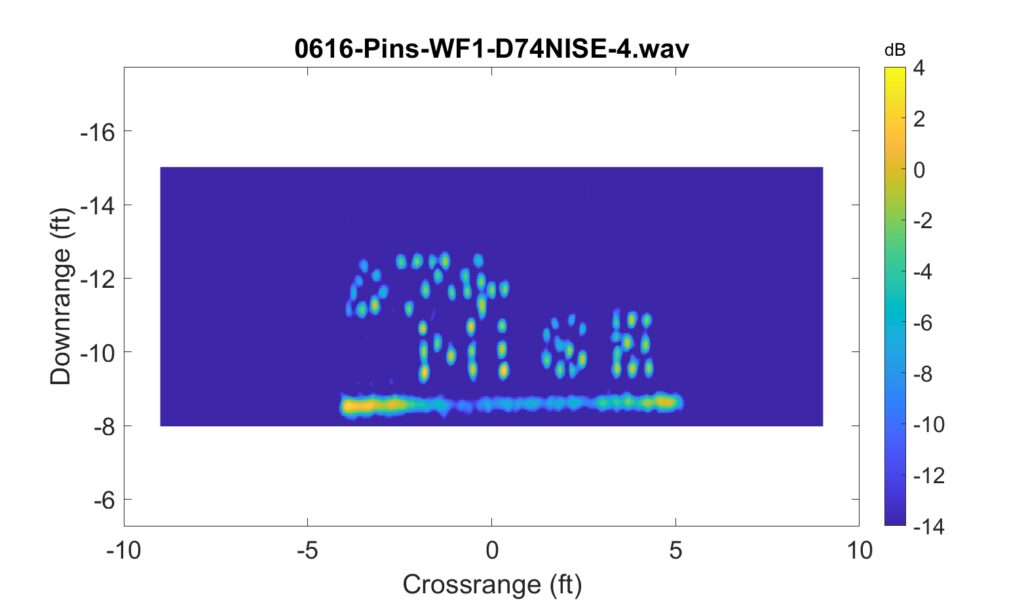
Once the data was collected, I used matlab to post process the wav file (just a wrapper for timeseries data) into SAR images. In the end, we were able to identify objects as small as thumbtacks with our system. Below are a couple of this SAR images of thumbtacks on a foam board.